Year 26 – 2013 – Payroll

 I haven’t looked at payroll very often; at least not as often as I think I should or would have liked.  Payroll can be a significant cost to an organization – easily representing 50% of a company’s total expenditures in some industries – but senior management seems to think that the controls over payroll are good and therefore it is low risk.   This belief is often transferred to audit even though studies, and the analysis I have performed over the years, have indicated that this may not be the case.  The ACFE Report to the Nations (2016) stated that payroll fraud occurred in 8.5% of the fraudulent disbursement fraud and had a median loss of $90,000.   It also stated that payroll schemes were twice as common in small organizations as in larger organizations.  This may add some credence to the belief that the controls are better in larger organizations but it may be simply that auditors in larger organizations are not looking at payroll; however, larger organization can sometimes have larger frauds.  When I did perform analysis on payroll I typically found errors and occasionally fraud.

As part of an audit at a large US city, I was asked to examine payroll.  The audit objective sought to ensure that the controls contributed to a payroll function that was efficient and effective and that pay was accurate.  I performed a number of common tests to support the audit objective.

In my post for Year 21 – 2008, I described an analysis which looked at the pay rates for different categories of employees.  This same analysis identified two employees who were being paid more than 25% over the pay rate for other employees in the same job category/position.   A second, simple, analysis identified eight missing check numbers.  The manager asked for more information and I replied, “I can’t tell you much more than you have eight checks that were not issued”.  I provided the missing check number and encouraged the manager, and the auditors, to look into the matter.  Missing checks could be checks that were accidentally destroyed when the check were being printed or (my concern) stolen blank checks.  The controls over the blank check stock needed to be reviewed as well as determining the procedures when checks were being printed (what do you do to damaged, misprinted, or otherwise unusable checks?).

Note: to perform the analysis by job category to identify employees being paid more than the usual rate for the category, I ran a Min/Max ratio analysis.  For each job category (rows in the output file), it calculates the Total amount and gives the minimum, maximum and average amount for each job category.  Starting in version 11, ACL provides a checkbox which will includes this information when you Classify or Summarize on a field.  In version 12, the option to include the standard deviation for each row was also added.

Another analysis looked at the length of time it took to get new employees on the payroll.  Using data from the HR system which gave the employee start date, I ran an analysis to determine how long it took before they received their first paycheck.  Management expectations that it would be the next pay period or certainly the second pay period, however the analysis showed that in 31% of the cases, employees did not receive their first pay for more than 28 days (almost four pay periods after their start date).  Drilling down by pay office revealed problem with the HR on-boarding process in two regions which contributed to the late paychecks.

I also did an analysis to determine if employees were being paid before their “start date” or after their “termination date”.  There was no evidence of control weaknesses in these areas.

ACL Commands – STATISTICS, GAPS, AGE, CLASSIFY, RELATE, and SCRIPT (Min/Max).

Lessons-Learned – Similar problems occur all the time.  It is worth looking at what types of controls weakness have occurred elsewhere when planning an audit.  Look at the ACFE and other reports produced by the big accounting firms, perform a simple Internet search, and check the ACL forum to see what others have found. I find the same types of problem are happening in different industries around the world.

Secondly, there is a reason why the standard set of commands were developed by ACL: they are useful.  I have used the basic commands thousands of times to perform useful analysis.  In this case GAPS, a standard ACL command, identified missing checks.  The results of the standard commands can be extremely useful – you need to understand when to use them and, importantly, how to interpret the analysis.

Lastly, even large payroll system can have errors; and when they do they can be even more significant.  I recently learned about a hospital payroll system which was being run on SAP that was overpaying employees (more than $1M in overpayments in a year).  It was a systemic problem tied to interfaces, pay tables, and complex hourly schedules, work days, and numerous employee classifications.  In another case, employees agreed to be on-call during the Australia Day public holiday, and were subsequently recalled for duty.  However, the payroll system did not identify this as a holiday and incorrectly calculated entitlements, resulting in significant underpayments.  These examples highlight the fact that auditors cannot rely on the controls – in fact the Statement on Auditing Standards (SAS) #94 states that substantive testing alone is not sufficient when the data is gathered, processed, and reported via IT systems.  It requires auditors to test the IT controls and recommends the use of analytics to do so.  This includes any IT system, not just payroll.

I have only discussed errors in employee pay, but there are also errors that can impact on income tax.  In Accounting Today Brian Cumberland, a managing director with Alvarez & Marsal Taxand, LLC in Dallas, offer his list of the top ten payroll errors: 1. Classification of Employees as Independent Contractors; 2. Failure to Subject Vendor Payments to Backup Withholding; 3. Failure to Issue Appropriate Tax Forms; 4. Not Including the Fair Market Value of Gift Cards, Prizes and Awards in Employees’ Income; 5. Failing to Timely Deposit Withheld Taxes; 6. Failure to Timely Deposit Withholding Taxes on Vested Restricted Stock and Exercise of Stock Options; 7. Incorrectly Excluding Expense Reimbursements from Reportable Wages; 8. Failure to Include Nonqualified Deferred Compensation in Executives’ Incomes; 9. Not Including the Appropriate Value of Taxable Fringe Benefits in Employees’ Income; and 10. Excluding Travel and Commuting Expense Reimbursements from Employees’ Income. (Source: http://www.accountingtoday.com/gallery/Top-10-Payroll-Mistakes-Companies-Make-62641-1.html)
Year 24 – 2011 – Fraud Detection – part 2

Continuing on from last week …..

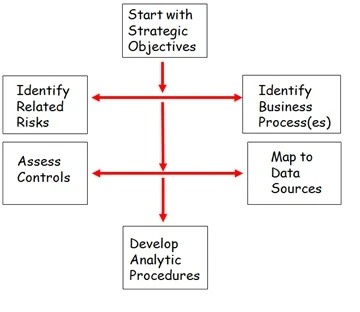
Figure 1 from the book “Computer –Aided Fraud Prevention and Detection: A Step-by-Step Guide” describes two approaches used to identify fraud risks and control exposures.  The first looks at control weaknesses and assesses how these exposures could be exploited.  The second starts with the key information or data fields and examines who could modify or manipulate these critical pieces of information; and then assesses the controls that should be in place to prevent this from happening.  The essential element of both approaches is examining the business process from the perspective of the fraudster – basically who can do what and why.

Figure 1 – Approaches to identifying fraud risks

 data_fraud

The first approach encourages you to think about the risks and possible control weaknesses; and to answer three questions:

  1. Who could benefit from the control weaknesses?
  2. What can they influence, control or affect to permit the fraud to occur?
  3. What would it look like in the data?

By looking at the adequacy and effectiveness of critical controls you can identify the critical opportunities for fraud.

The second approach starts with the key fields and identifies the key controls that should be in place.  You are encouraged to consider the key pieces of information required by the business process; and ask four questions:

  • Who can create, modify or delete this information?
  • Why might they do this?
  • What are the key controls to prevent this from happening?
  • What tests can be performed to see if someone is committing a fraud?

Once you have identified a control weakness or key fields that could be altered in order to commit a fraud, the next step is to examine the actual data.

There are two types of symptoms of fraud that may occur in the data known and unknown.  The ideal situation is one where the risks are measurable and the symptoms known.  In these cases, it is possible to develop specific tests to look for symptoms.  However, sometimes the symptoms are not well-known or understood.  Another approach looks for anomalies or patterns in the data to detect symptoms of fraud – unknown symptoms.  Fraud in particular, often looks different than a normal transaction – but is hidden by the volume of transactions.  The fraudulent transactions often follow an unusual pattern or trend, such as an excessive use of management override to bypass key controls.  By filtering, sorting, summing, and performing other manipulations on the data, the fraud transactions often stand out.  A filter can easily identify instances where contracting authority was exceeded (e.g. contracts over the contracting limit for the individual) or avoided (e.g. split contracts).  A simple sort on credit card number, insurance policy number, invoice number, vendor name, employee number, etc will quickly reveal transactions that are not within the normal pattern (e.g. insurance policies that start with ‘9’ where all others start with the year “2014”).  Examining key dates can find fraud – for example reviewing the date the contract bid was submitted to find bids submitted after bid close date; or identifying patterns in the contracts such as the ‘last bid wins’.  A review of the completeness and integrity of the data can highlight fraudulent transactions – for example, examining mandatory fields to identify instances where there is no employee number, or an invalid employee number, but the employee is still being paid; or negative receipt quantities where the receiving clerk is entering negative “receipts” to lower the inventory levels in the inventory system and then stealing the “excess” items.  Comparisons of data in different systems can also identify frauds such as persons on the payroll who are not in the employee database or can highlight unusual rates of pay.

Data analysis can provide you with an indication of where to look and what to look for.  It can focus your review; and help you to rule out transactions that are correct.  In addition, with known frauds, you can use it to size the extent of the loss.  You can also use it to see if the same symptoms are occurring elsewhere.  Finally, in many cases, data analysis will be a direct pointer to the critical evidence – the forged check, the serial number of the stolen item, or the evidence of collusion.

Lessons-Learned – using analytics to detect possible frauds is only the start.  I have successfully identified possible fraudsters and then failed to follow through sufficiently to “prove” the fraud.  As a result, they got off the hook.  At the same time, I have run analytics that looked pretty solid, but in the end exceptions, misinterpretation (or even worse – incorrect analysis) falsely identified the person as a fraudster.  You have to pursue the guilty and protect the innocent.  In either case, it is important to validate and verify; and then trust your analysis so that you don’t fall for the misdirection and excuses you are being fed by the guilty parties.

Year 24 – 2011 – Fraud Detection – part 1

By 2011, I was becoming more and more involved in data analysis to detect fraud.  I had been doing this for years but had never really thought about the approaches I was taking to assess fraud risk and determine the analytics to perform.  The following is the result of my deliberations (which continue to this day).

Fraud Detection

The unrelenting advancement of technology is affecting virtually every aspect of our lives.  And as technology becomes more pervasive, so do schemes to commit fraud. Fraudsters are taking advantage of users’ inexperience with newer technology and weaknesses in the controls to perpetuate these schemes.  This is proving to be a challenge for evaluators, auditors and investigators in their efforts to identify and detect fraud.  However, technology is also a tool that can help prevent and detect fraud. Data analysis techniques can search for the symptoms on fraud that are buried in the millions of transactions flowing through the business process.

Whether you are investing to see if a fraud occurred or following up on an allegation of fraud, a good first step is to understand the ‘why’ of fraud.  The “Fraud Triangle”, created by famed criminologist Donald Cressey, outlines three basic things that must be present in order for fraud to occur: opportunity, pressure or motivation, and rationalization.

Opportunity.  An opportunity is likely to occur when there are weaknesses in the internal control framework or when a person abuses a position of trust.  For example:

  • organizational expediency e.g. it was a high profile rush project and we had to cut corners;
  • downsizing means that separation of duties no longer exists;
  • business re-engineering removed checks and balances in the control framework

Pressure.  The pressures are usually financial in nature, but this is not always true.  For example, unrealistic corporate targets can encourage a salesperson or production manager to commit fraud.  The desire for revenge – to get back at the organization for some perceived wrong; or poor self-esteem – the need to be seen as the top salesman, at any cost; are also examples of non-financial pressures that can lead to fraud.   In addition, living a lavish lifestyle, a drug addiction, and many other aspects can influence someone to commit fraud.

Rationalization.  In the criminal’s mind rationalization usually includes the belief that the activity is not criminal.  They often feel that everyone else is doing it; or that no one will get hurt; or it’s just a temporary loan, I’ll pay it back, and so on.

Interviews with persons who committed fraud have shown that most people do not originally set out to commit fraud.  Often they simply took advantage of an opportunity; many times the first fraudulent act was an accident – perhaps they mistakenly processed the same invoice twice.  But when they realized that it wasn’t noticed, the fraudulent acts became deliberate and more frequent.

Interestingly, studies have shown that the removal of the pressure is not sufficient to stop an ongoing fraud.  Also, the first act of fraud requires more rationalization than the second act, and so on.  As it becomes easier to justify the acts occur more frequently and the amounts increase in value.  This means that, left alone, fraud will continue and the losses will increase.

While I have been unable to find conclusive evidence to support the 10-80-10 rule, but it is well known in the ACFE-world.  Basically, it states that 10% of the people would never commit fraud; 80% might; and 10% are actively searching for opportunities to commit fraud.  I think as auditors and fraud investigators we must be concerned not only with the 10% who are actively attempting to commit but, but also the 80% who might.  By ensuring that the fraud triangle is not adversely affecting these people we can prevent fraud and save people careers and lives.

Pressure – audit can examine corporate performance targets and inform management of times when targets are likely to contribute to cutting corners, bypassing controls and possibly committing fraud.

Rationalization – an audit of corporate value and ethics program and the top-at-the top can help to make sure that the tone-at-the-top is aligned to organizational goals and objectives.

Opportunity – by performing fraud risk assessments and addressing control weakness in the areas most prone to fraud audit can protect the 80% from making a mistake.

Next week I will describe two approaches that can assist you in determining where you have fraud risks and the data you require to perform analytics to determine if fraud is happening.

Year 20 – 2007 – Inventory

It was hard to believe, but I had now been at this (data analytics to support audit) for 20 years.  And I still found it interesting, challenging, frustrating, rewarding and aggravating – all at once.

I was constantly being asked to access new systems and perform analysis for different types of audits.  At the same time, I had my regular monthly routine tasks of extracting, downloading and cleansing data we used on a regular basis.  For example, the SAP extract – full year-to-date extracted and download every period – would take most of the day to perform by the time I got to period 8.  I could only download one period at a time because of CPU limitations – so I would start a background extract of period 1 and work on other things.  When it finished, I would extract period 2 and download period 1; and so on until I reached the current period (AX and DirectLink would have made things much simpler).  In addition, I had to extract and download the 12 master tables (vendor, customer, cost centre, GL, etc) that I needed every quarter.

Once all year-to-date extracts had been performed, I had a script that combined the periods and transformed the detailed transaction (BSEG table) and the header (BKPF Table) into a more useful data set where the customer and vendor information was on every line of a document.  The script also produced a snapshot of the controls and summary files (by GL; by Cost Centre; by Vendor; etc.).  Next I would combine data from the previous “X” years to produce multi-year summaries (by GL by year; by Cost Centre by year; etc.).

Continue reading Year 20 – 2007 – Inventory

Year 19 – 2006 – Health Claims

Note: I hope this is like the ACL forum where there are more people reading it, but not posting questions/answers.  While I am enjoying my trip down memory lane – it is a lot of work and it would be a shame if I was the only one reading the posts.  My aim was to encourage discussion and sharing – this is not happening and lessens the value of the blog.  So post a comment, describe your experience, etc.

My early introduction into audit included the concept that audit was an early warning for management (this was before “independent assurance”).  It had the notion of identifying things that were going wrong and making useful recommendations (this was also before the idea of “risk”).  However, my belief was always that audit was there to help; and that the help could and should be offered to all levels of management.  Luckily, I did not see these as incompatible ideals; and to a certain extent so did my managers.

I remember often having discussions over who was audit’s “client”.  We reported to the Board – and they were the main recipients of our reports.  So they were a client.  Senior management also received the reports and responded to the recommendations – so they were a client.  But local management was the group being assessed and had to implement the recommendations – so this made them a client.    The issue was, the three groups had very different motivations and needs.  A high-level report was of little value to the local manager who need to fully understand the “cause” associated with the finding in order to be able to adequately address the issue; whereas senior management and the Board were more concerned with the impact.  Hence the ongoing debate of “who is our client”.

For a number of years, we actually produced three levels of reports.  The local manager detailed report with criteria, condition, cause, impact and recommendations; the management report which focused on the “what does it all mean” (impact and recommendation; and the Board report which presented an overall assessment.  In the end we were spending as much time writing the report(s) as performing the actual audit.

Your thoughts/experience on who is your client and how do you address the needs of your audience?

Auditors are often asked to examine fairly sensitive areas.  This can also mean that you have access to personal information.  Depending on your definition, this could be executive compensation, but in this case (for me) it was health claims.

Continue reading Year 19 – 2006 – Health Claims

Year 17 – 2004 – Part 2 – Construction

From time to time I was lucky enough to get to do some consulting work.  These were usually fairly large audits, involving a number of external experts.  As the “data guy” I was often given very little time to perform the required analysis.  On such audit was a review of the costs for a major construction project.  The audit team did not have all of the necessary expertise and had hired experts in project management, construction, and data analysis (me).  It was interesting to work with experts from outside of audit and in an area that I did not have a lot of expertise (construction).

The audit was requested by senior management.  Management was concerned because they knew that the manager responsible for a major, multi-phased, construction project would have a great deal of influence over the contractors.  It was early in the construction project and millions of dollars worth of contracts were still up for grabs.  Management felt that this put the project manager in a position where he could request “favors” from the contractors in exchange for the promise of future contracts.  They also knew that the company did not have a lot of experience in managing construction projects.  For these reasons they requested that audit perform a multi-phased review of the project – starting with the controls over the project management office.

It was not a surprise to anyone when the auditors determined that the project manager had arranged for one of the contractors to do work on his house, and bill the cost to the company.  But, the audit director was curious about how the auditors had found the fraud so quickly.  They had only been at the construction site for three days, and had already uncovered more problems than any other audit team had found in audits lasting months or longer.

Continue reading Year 17 – 2004 – Part 2 – Construction

Year 17 – 2004 – Part 1 – Direct Deposit

This was the year that I re-published my second book “Fraud Detection: A Revealing Look at Fraud (2004).  This dealt with obtaining, verifying and analyzing the data to support fraud prevention, detection and investigation.  However, it was also relevant to regular internal audit analyses.

I thought I would do something a little different this week – so here is a fraud analysis story.  It is based on an actual fraud analysis that I performed.  In telling this story over the years, I have had a number of people tell me that their company had experienced a similar type of fraud.  Which raises the question: “Why do companies so often ignore basic controls like separation of duties?”

Direct Deposit – Bill was not happy when he returned from the quarterly management meeting and Tom wondered why.  Bill explained a fraud that had been discovered – but not by internal audit.

“It went like this,” said Bill, “you know how we employ a lot of casual workers – people who may show up for anywhere from 1 day to 6 months.  Well it seems that an 8-month investigation in the payroll area has determined that the person in charge of keeping the attendance records has been committing fraud.”

“Wait a second’, exclaimed Tom, “we haven’t been conducting an investigation”.

Bill shook his head, “that is part of the reason why I am so upset.  First there was a fraud, and second we weren’t even notified – contrary to what the corporate fraud policy states, I might add.”

The supervisor of the payroll section noticed a weakness in the system.  Even though the casual workers were not around for long, everyone was paid by direct deposit.  This procedure was put into place when a fraud involving payroll checks was discovered a few years back.  The weakness was two-fold – first, the payroll supervisor was responsible for the sign-in sheet.  Every time a casual employee reported to work, they signed in and recorded their hours.  The second weakness was the fact that the same supervisor was responsible for the entry and update of the basic employee data, including the direct deposit number.  Seems that, upon learning that a casual employee was not planning on returning to work, the supervisor would continue to record their attendance, but would change the direct deposit number to a bank account that he controlled.

“Nice scheme”, responded Tom.  “I presume he kept his extra earning down to a minimum amount.”

“Sure,” said Bill.  “He never kept anyone on for more than 20-30 hours, but with so many casuals, he was clearing an extra week’s pay every week.”

The scheme was discovered when a casual worker received his income tax statement and compared it to his paychecks.  He called to talk to the supervisor, who just happened to be off sick that week.  A new employee, eager to impress her boss, researched the problem while the supervisor was off and discovered the fraud.

Now Tom was confused.  “It sounds pretty straightforward to me.  Why did it take eight months to investigate the fraud?”

Bill explained, “She called the police and they pulled all of the attendance sheets and copies of the bank statements.  Then they did a manual review – looking for the same direct deposit number turning up for more than one employee.  Seems that our payroll supervisor was not working alone, his girlfriend also had several checks deposited to her account.”

“Still – eight months?” cried Tom.

Bill laughed, “You’re right.  Since this was a white-collar crime, they only worked on it when there was a lull in other police work.  As a result, we lost even more money, and the payroll supervisor found out about the investigation and had time to make a run for it.”

“Well I guess we lost another one,” lamented Tom as he headed for the door.

“Get back in here – were not done with this yet,” said Bill.  “I want you to verify the police work – make sure they didn’t miss anything.  And I want it today!”

Using data analysis, all pay transactions for the last two years were examined – looking for all instances of the same direct deposit number being used by more than one employee.  While it did identify two cases where the husband and wife both worked for the company, it also identified four accounts that had been used to collect extra pay.

Bill smiled, “that is two more than the police found.”

“And it only took 45 minutes,” said Tom.

But still Bill wasn’t happy – something was nagging at him.  Tom was just about to ask what the problem was when Bill shook his head and exclaimed “Boy, am I a fool”.

Tom bit his tongue and did not reply “Yes, but why do you ask?”

Instead he waited for Bill to continue. “I wasn’t happy when I heard that the police had conducted a manual investigation.  I knew that matching direct deposit number to employee was much easier for a computer.  But there was more to it than that – I just didn’t realize it until now.”

Tom couldn’t wait any longer, “What?” he said.

Bill just looked at him and replied, “Run the analysis for all of our payroll sections across the country.  If it is happening here, I’ll bet my last dollar it happening elsewhere.”

Tom walked into Bill’s office two months later and said, “That clears up our payroll fraud case.”

“What was the final result?” inquired Bill.

“Well, we recovered close to $209,000 and are prosecuting four people – the criminal cases look promising.” replied Tom.  Bill waited.  “Oh ya, and we fixed the control weakness too.”

Finally, Bill was pleased; the data analysis had taken less than two days to complete, was instrumental in proving the case in court, and had been easy to do.  But most of all, the direct deposit fraud had been properly and thoroughly dealt with.

ACL Commands: DUPLICATES and JOIN

 Lessons Learned:  1. The police don’t always place the same priority on a fraud investigation as you might like.  2. Fixing one control weakness may create another – it is important to review all controls when making changes to procedures.  3. Data analysis is often the ideal way to find evidence of fraud.        4. Once you have found a fraud and understand the control weaknesses exploited, look for additional cases of fraud.

Year 14 – 2001 – Fraud Analytics – part 2

The “Big one that got Away” – involved hundreds of millions of dollars in contracts for hardware and software maintenance over ten years.  I ran a couple of tests to highlight red flags related to fraud risks and identified the fraudster a couple of times – but didn’t pursue the issue enough to uncover the fraud.

The first red flag was identified when I performed an audit to determine if we had employees who were also contractors.  This test identified a contracting officer (Paul).  When his manager was asked whether Paul (the employee) had declared that he was also serving as a contractor we were told that our test was inaccurate because Paul was not an employee.  We pointed out that for ten years Paul was: on the organization chart; had employees reporting to him; had an office and phone; had contracting authority and was responsible for a budget.  If he was not an employee then this was an employer-employee relationship which was against policy and a serious risk.  The manager said “not to worry, we will hire him” and did so.  I was told to close the file on the issue.  Strike One.

Later that year, I was purchasing 20 laptops for the audit department.  The contract went to Paul for approval and he called me.  He was combining a bunch of purchase and trying to get a bulk purchase discount and wanted to know if I was willing to include my laptops in the package.  I agreed as long as I got the same quality for the price.  When the laptops arrived they were lower CPU speeds and cost more than what it would have cost me for the better laptops.  I called Paul and complained, but he rationalized the purchase by saying that we did really well on the desktop computers and had to give a bit on the laptops.  I wrote an email to his manager and received an answer that was identical to the verbal response from Paul (obviously Paul had told his manager how to respond – maybe even wrote it for him).  I checked to see if the contractor who supplied the laptops was the same one Paul used to work for – it wasn’t.  (Later I learned that I had not dug deep enough – the firm who delivered on the bulk purchase was a subsidiary of the firm Paul had worked for.)  I was told to drop the issue since apparently our company had done well on the bulk purchase overall.  We never actually verified that we had saved on the bulk purchase.  Swing and a miss – strike two.

Continue reading Year 14 – 2001 – Fraud Analytics – part 2

Year 14 – 2001 – Fraud Analytics – part 1

After my year of consulting in numerous private sector companies I felt that my experience not only with ACL, but also with risk assessment and fraud risk assessment in particular had grown.  While ACL’s basic command set was powerful, there were a number of techniques that I had used specifically for fraud that were not (at this time) included in the basic ACL command set.  They required the use of ACL scripts and since the ACL programming language and was beyond most basic users of ACL, I thought that a book which contained not only case studies and the scripts, but an explanation of how each script worked would be useful to the ACL user community.  While not originally designed as such, it was used by many people as a self study course on ACL scripting.  Once again the book was well received – with many expert users praising it for helping them to improve their own ACL skills when they were beginners.

I would like to think that the toolkit, originally published by ACL in 2001, encouraged them to expand the command set available in ACL.  The scripts included a number of functionalities that would later be added to ACL’s basic command set such as Crosstab (added 2010), Benford analysis (added 2010), Frequency of numeric value (added 2015), and Min/Max ratio (added 2015).  (Note: some of the dates may be incorrect – hard to remember exact versions when ACL commands were added, but it was years after the toolkit was developed.)  So, much to my surprise, I was a thought leader in the analytics space.

The toolkit, now called “Fraud Analysis Techniques using ACL” is still being published and used.  In the latest addition published by John Wiley and Sons, I added a self-study course on ACL scripting – complete with data, exercises and solutions as well as some generic scripts that perform useful function such as “unbucket” and “flatten” a data file.  The notion of providing standard useful scripts has also been adopted by ACL in their Script Hub (in 2012) – so again I was ahead of the curve in providing functionality to users.

Continue reading Year 14 – 2001 – Fraud Analytics – part 1

Year 12 – 1999 – Part 2 – Drilling down into A/P risks

Technically, we were still in the planning phase of the A/P audit – but had already identified several areas of risk that needed to be analyzed further.

The early payments represented a potential fraud.  If you paid within 15 days, you should receive an early payment discount of between 1.5 -2.5% depending on the vendor’s terms.   In addition to reviewing the invoices with ‘immediate’ payment terms, we calculated the difference between the latter of the receipt of goods or invoice received date, and the check date.  Then we stratified using intervals of 0-5, 6-10, 11-15, 16-20, 21-25, 26-30, and >30 days.  The total number and amount of transactions paid within 15 days was determined.  The analysis showed that only 4.6 percent of the transactions were paid within 15 days, however, this represented almost 16 percent of the total payments made.

The auditors review the transactions that were paid within 15 days and found that early payment discounts were claimed in 87% of the cases.  A Classify determined that the other invoices were all processed at the same A/P office; belonged to only three vendors; and were processed by two A/P clerks.  The unclaimed early payment discounts, calculated at 2%, totaled $832,000.

The team leader had concerns about two possible fraud scenarios.  In the first, the A/P clerk processes the original transaction for the full amount of the invoice and subsequently requests a credit from the vendor, for the early payment discount amount, and keeps the credit.  The second scheme involves deliberating pay invoices early, without claiming the early payment discount, and receiving a kickback from the vendor.

To identify the first type of fraud, the team leader send out confirmation letters to the three vendors that had been paid early, requesting them to provide details on the terms and amount of the payment.  All three vendors replied that they had initially been paid the full amount, but had subsequently sent the company a check for the amount of the discount.  The auditors asked the companies for copies of the canceled checks; the two A/P clerks had endorsed them all.

Continue reading Year 12 – 1999 – Part 2 – Drilling down into A/P risks